Kafka Monitoring Suite
The Lenses Kafka Monitoring Suite is a set of pre-defined templates, that use
- A Time Series database (Prometheus)
- Custom JMX exporters
- A Data Visualization application (Grafana)
- Built-in domain intelligence about operating Kafka with confidence in production
Lenses is great at continuously monitoring your Kafka cluster and can raise alerts for important metrics degradation, such as consumer lag and offline or under-replicated partitions. However, it does not strive to become a time series database because there are well established solutions the likes of Prometheus. See kafka monitoring suite setup for details.
Landoop’s monitoring reference setup for Apache Kafka is thus based on Prometheus and Grafana software with a medium-term goal to bring more dashboards from Grafana into Lenses.
A question that comes up often, is whether monitoring is really needed since Lenses can provide alerts. This should be answered eventually by each implementation team.
Keep your alerts and key metrics to a small tight set, so that you won’t get overwhelmed. This is a good, common advice and what we want to achieve through Lenses, alas it is also prone to misconceptions.
Alerts and key metrics are related to monitoring but are not the same. We define monitoring as the process of collecting a large number of metrics and storing them for a period of time. Queries to these data help engineers understand the cluster better, establish baselines so they can plan for additional capacity or act on deviations, or even extract new, important key metrics for a specific use case as the team acquires more experience in the field. Furthermore, new alerts can be added to any metric —or combination of them.
Demo Dashboards
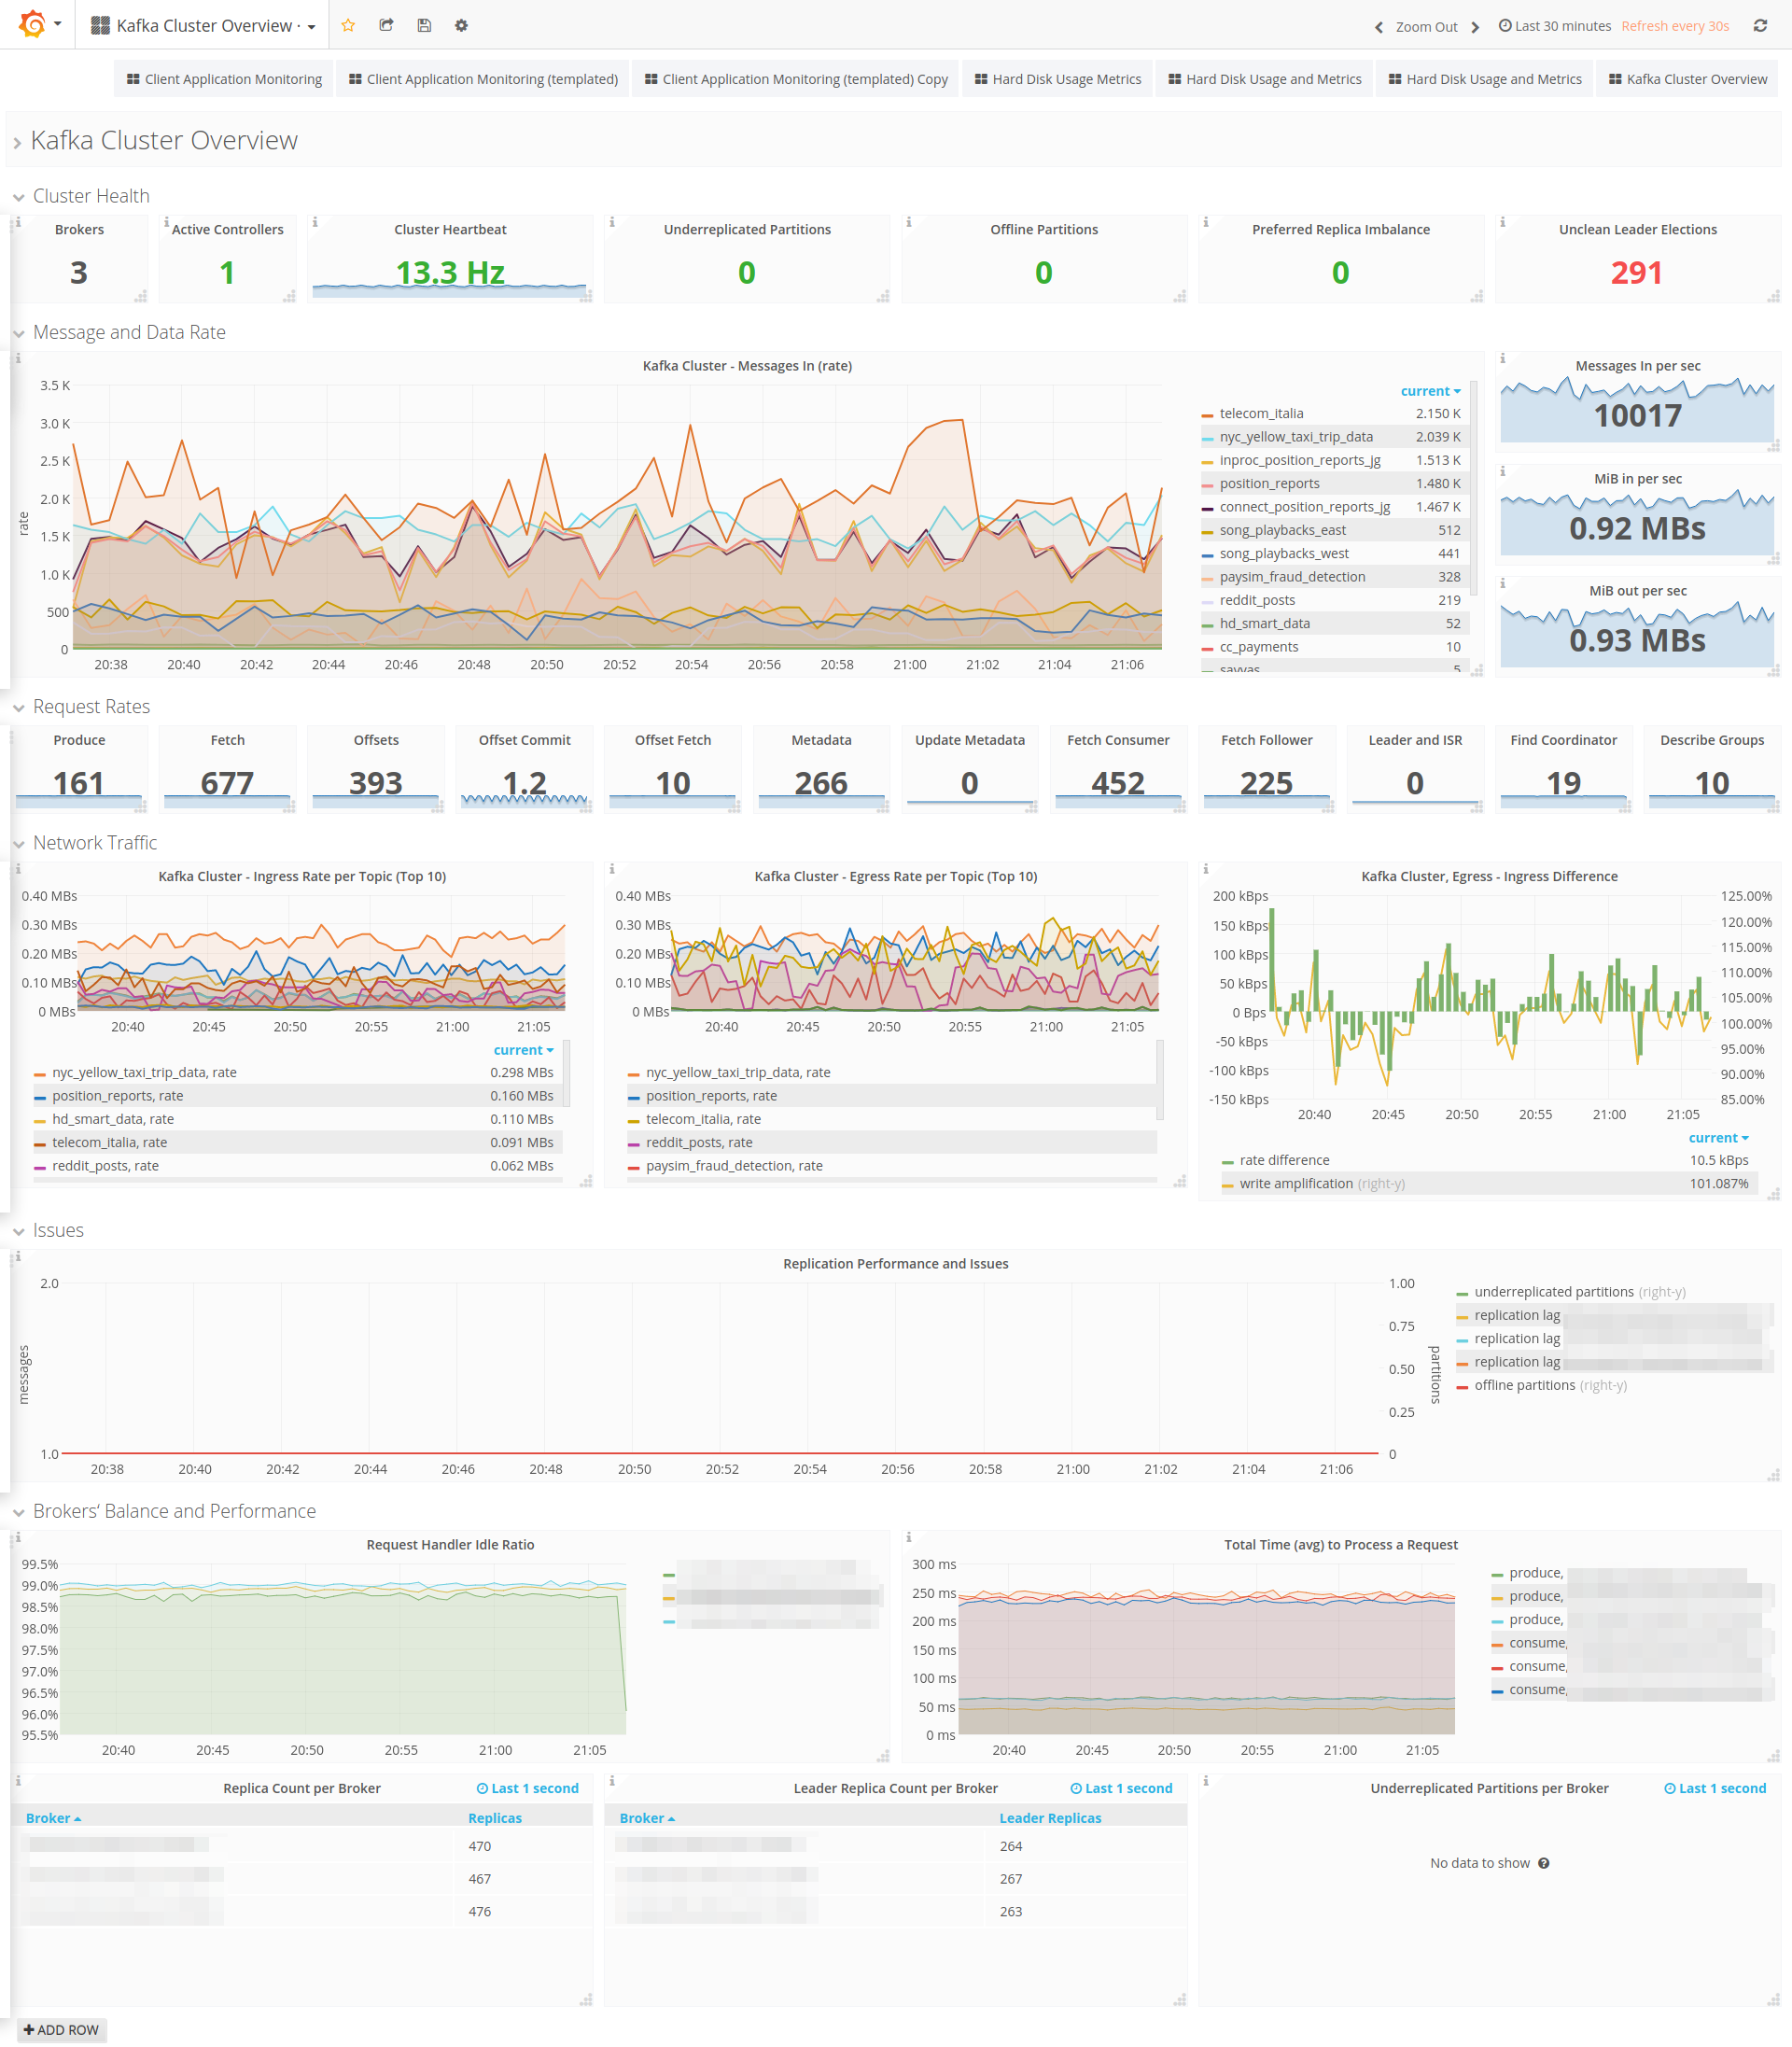
Kafka Cluster Metrics
A 360-degree of the key metrics of your Kafka cluster curated into a single template, that allows to time travel between the past 60 days (by default) of key metrics, and pro-actively receive alerts and notifications when your streaming platform is under pressure or signals of partial failures appear.
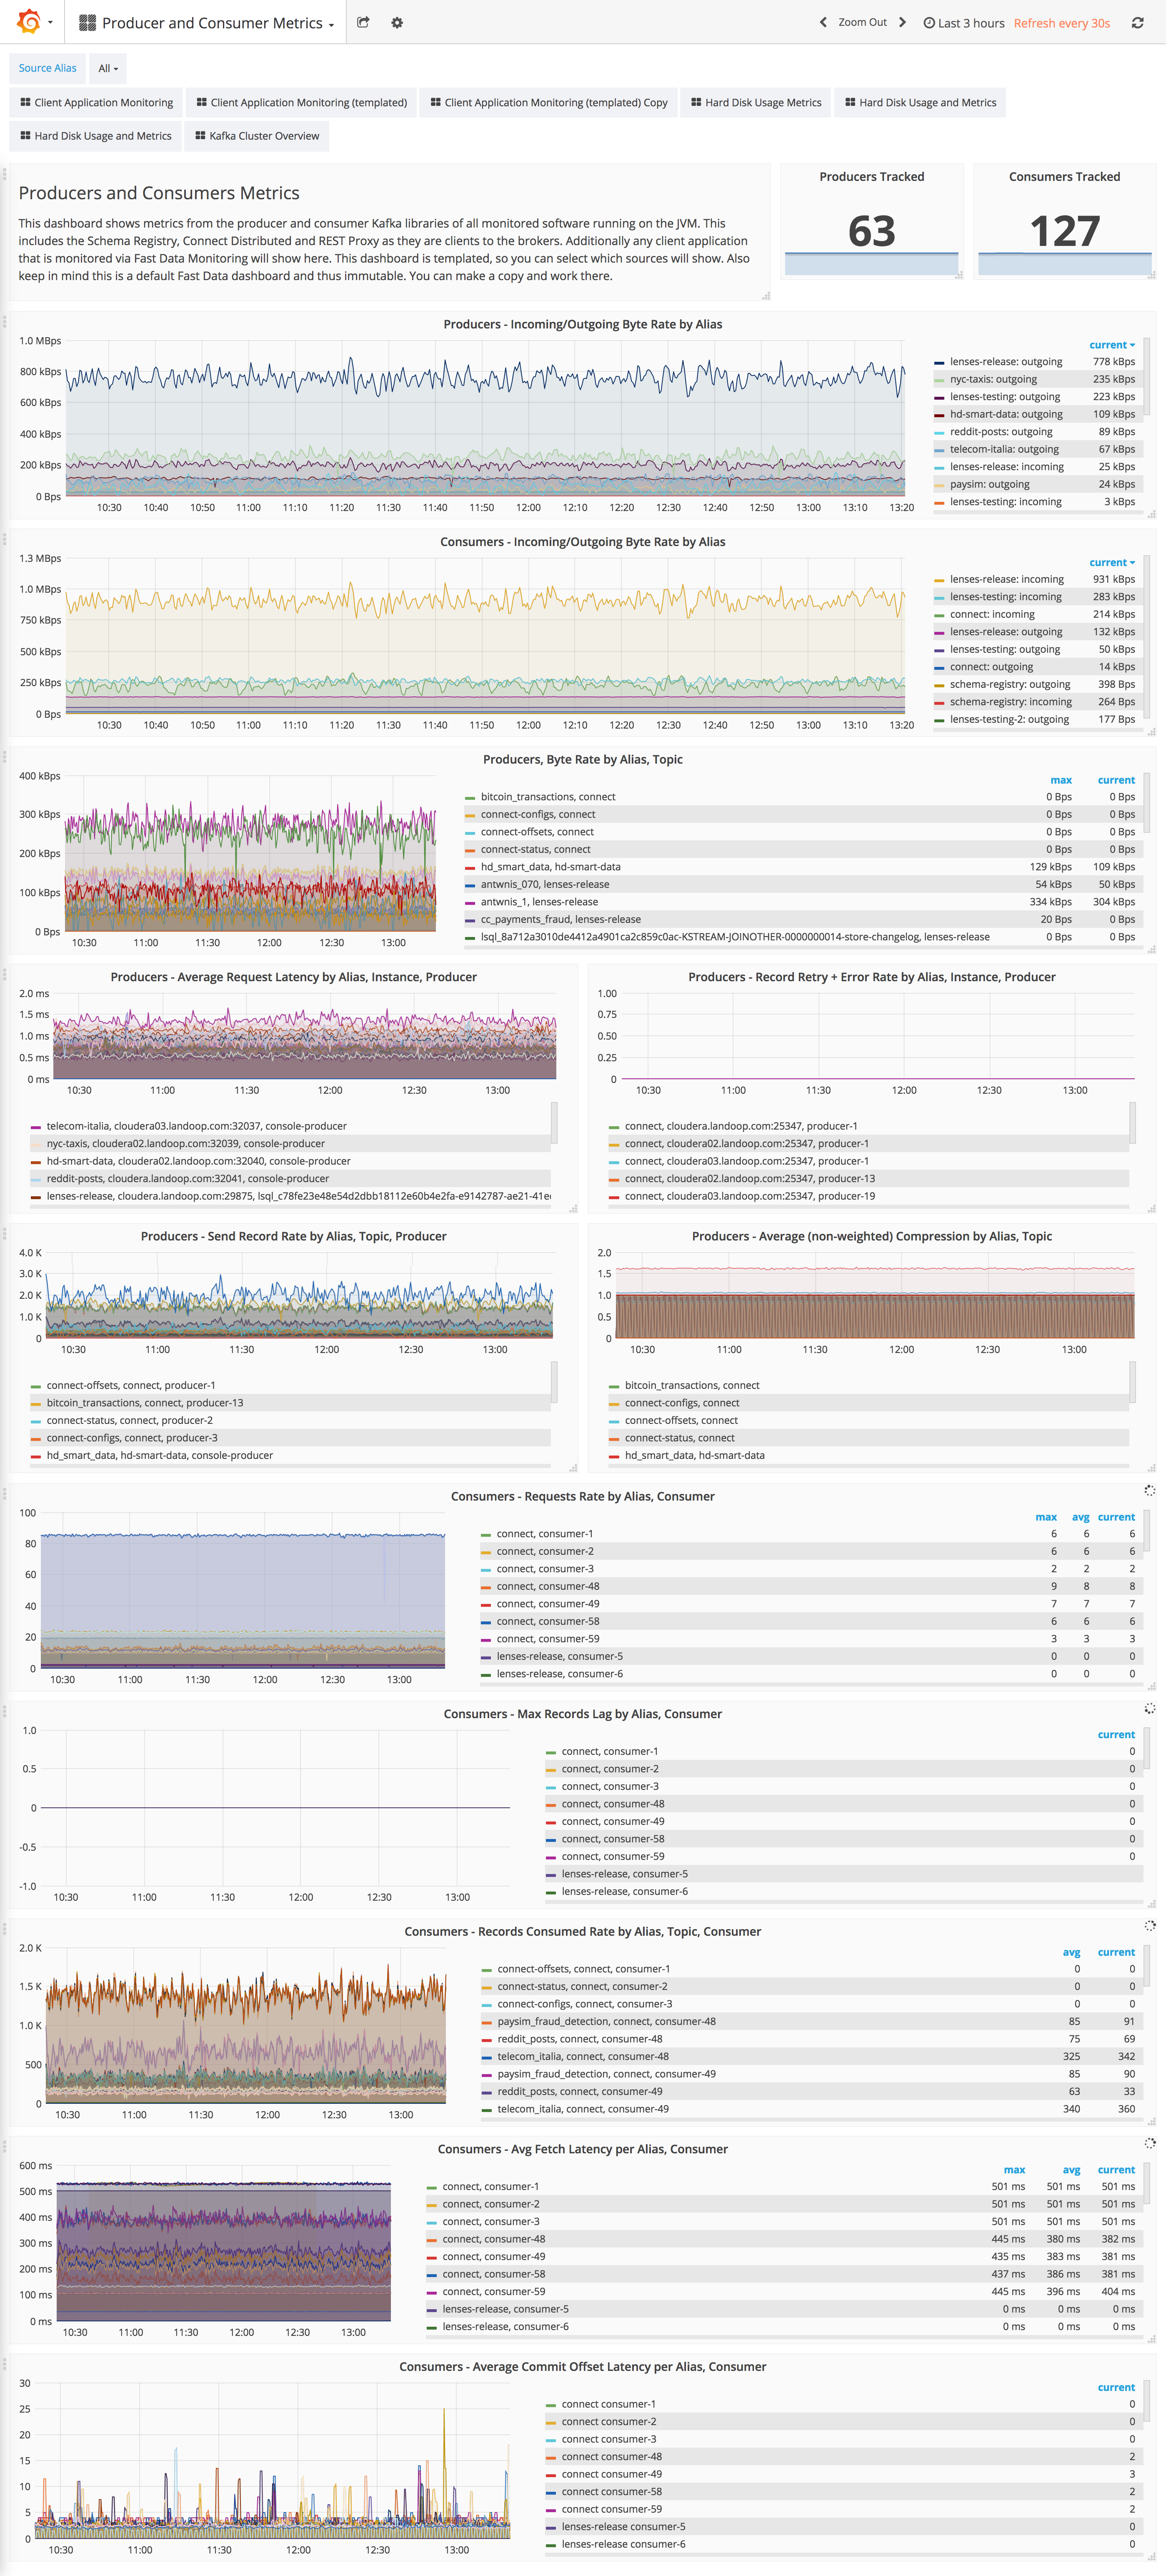
Consumer Producer Metrics
All Kafka Consumer or Producer dashboard to include all metrics for Kafka brokers, Zookeeper, Schema Registry, Connect Distributed, REST Proxy, Lenses and any other JVM application that is connected to Lenses Monitoring.
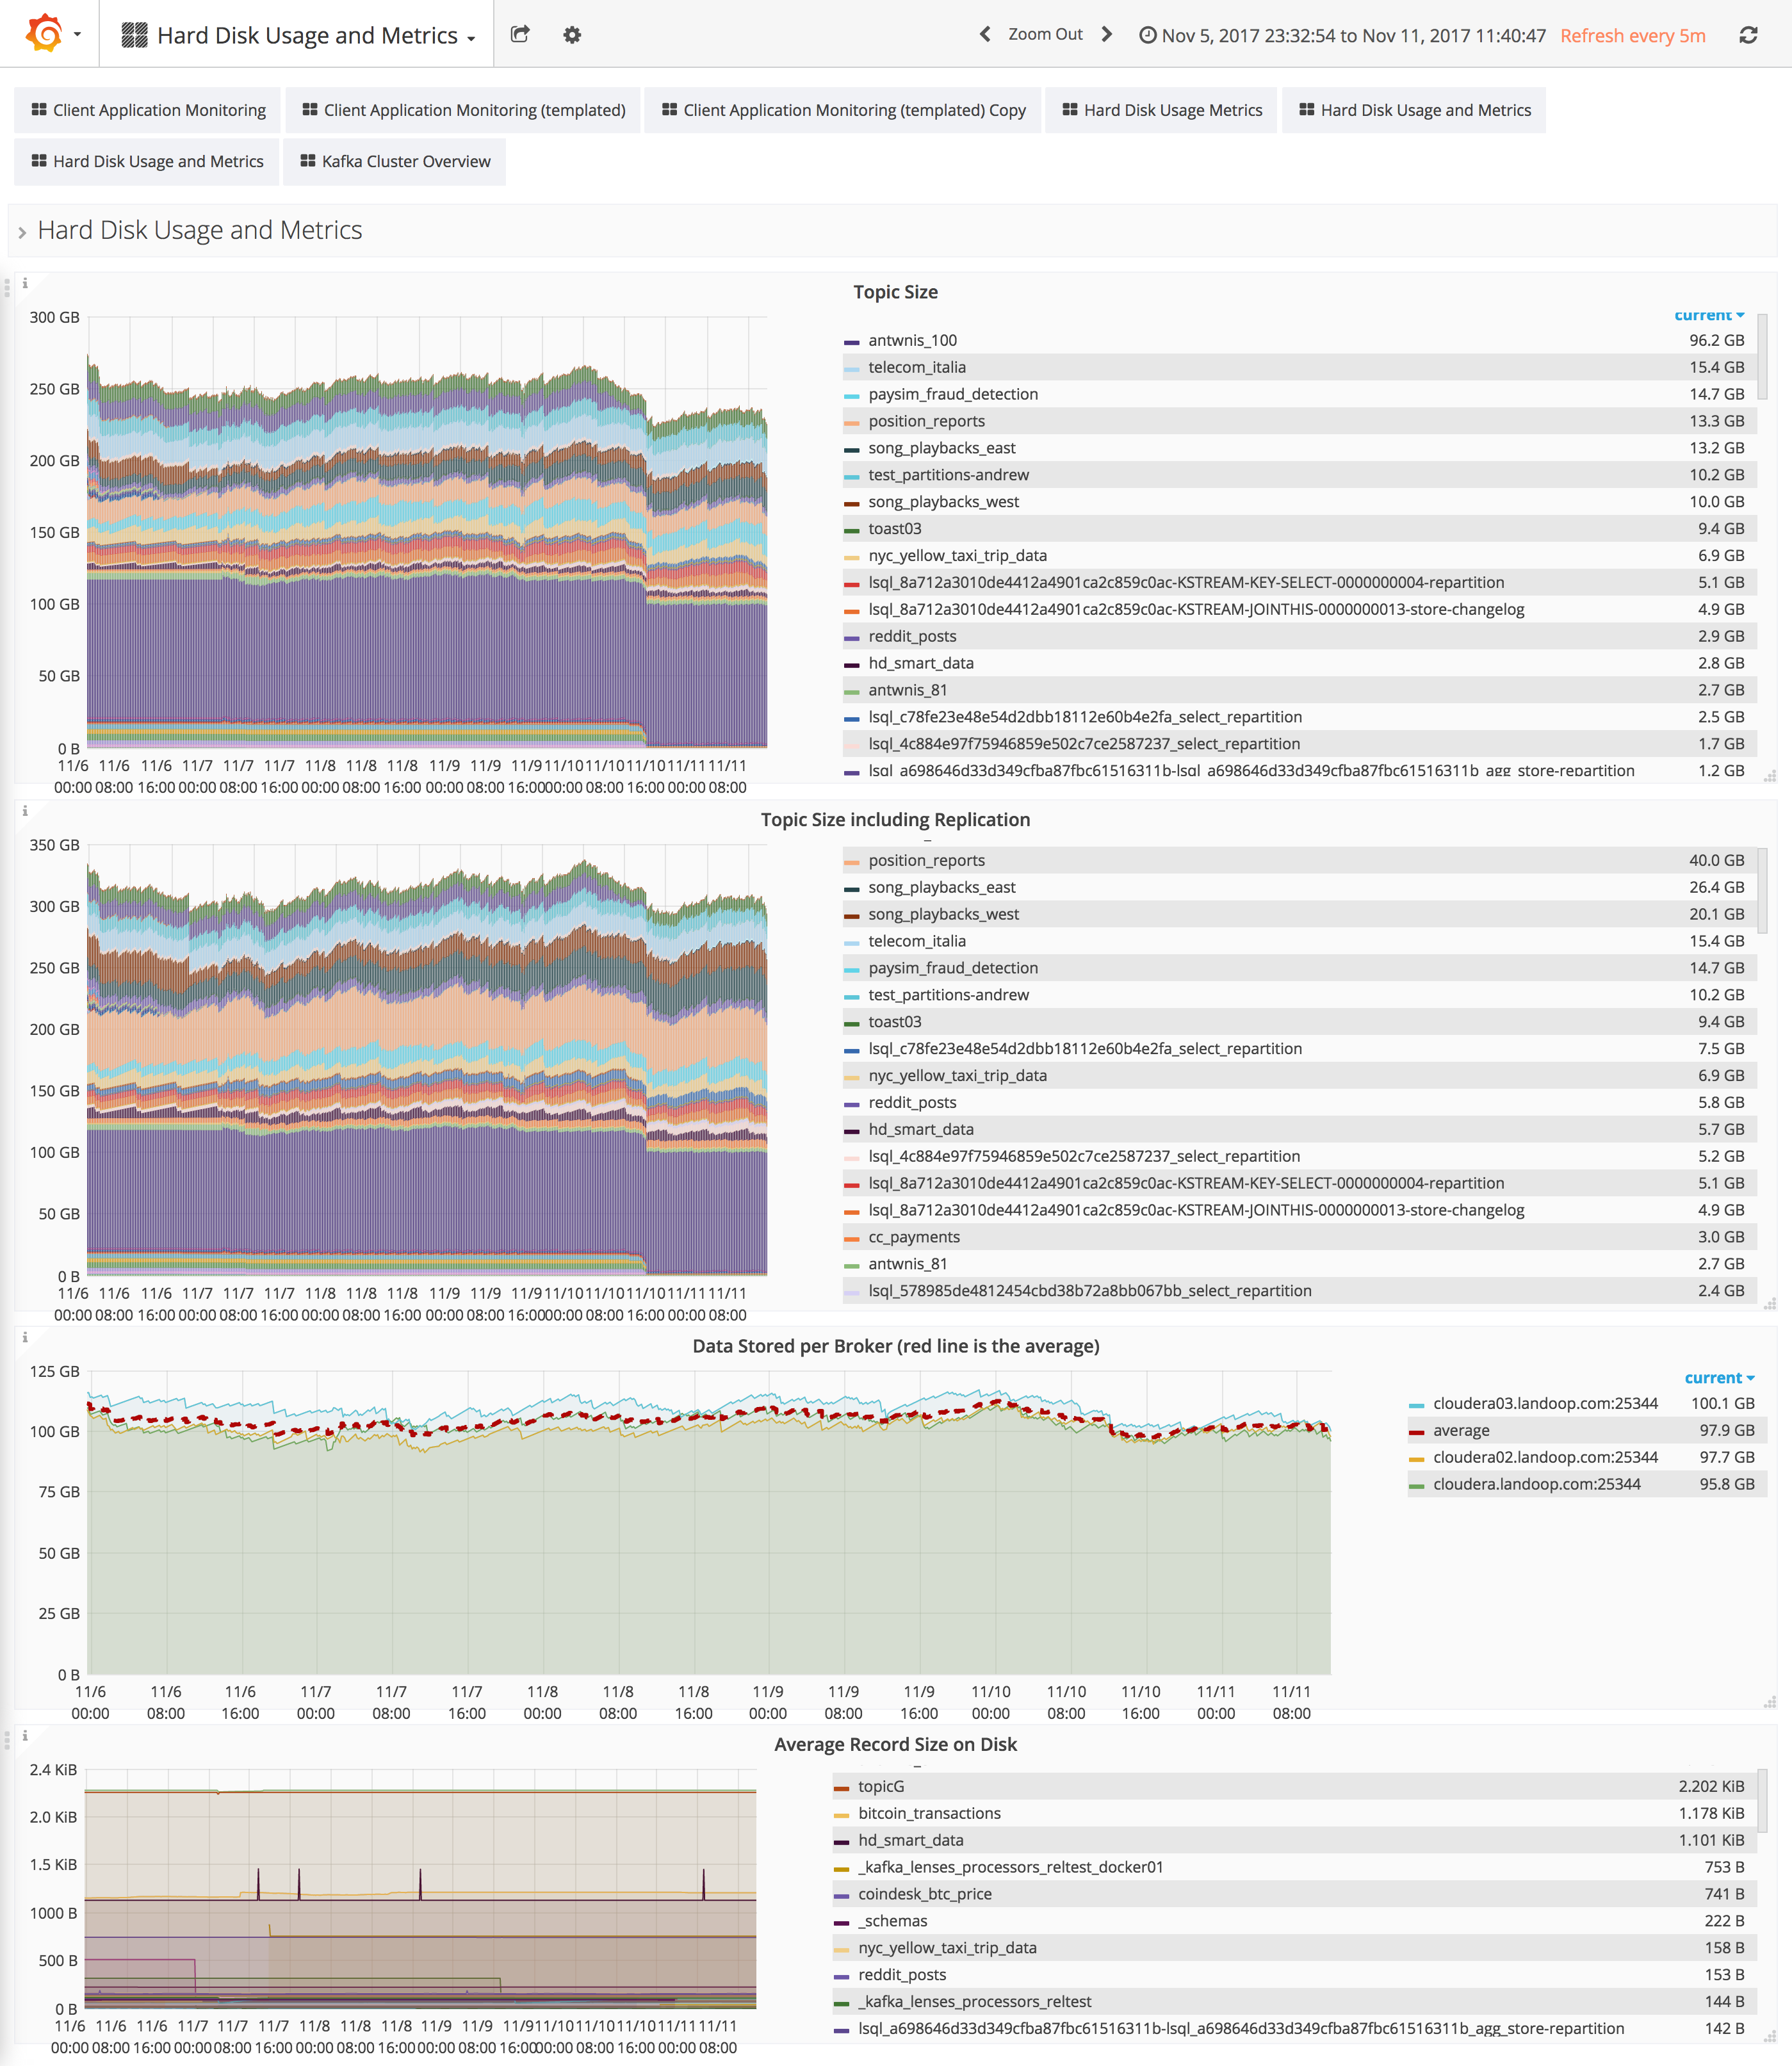
Hard Disk Usage Metrics
A dashboard to display the approximate metrics about the size (in bytes) of your topics. It is useful for planning disk capacity and having an overview of each topic’s size. The “Data Stored per Broker” graph can be used to detect storage imbalances between brokers.
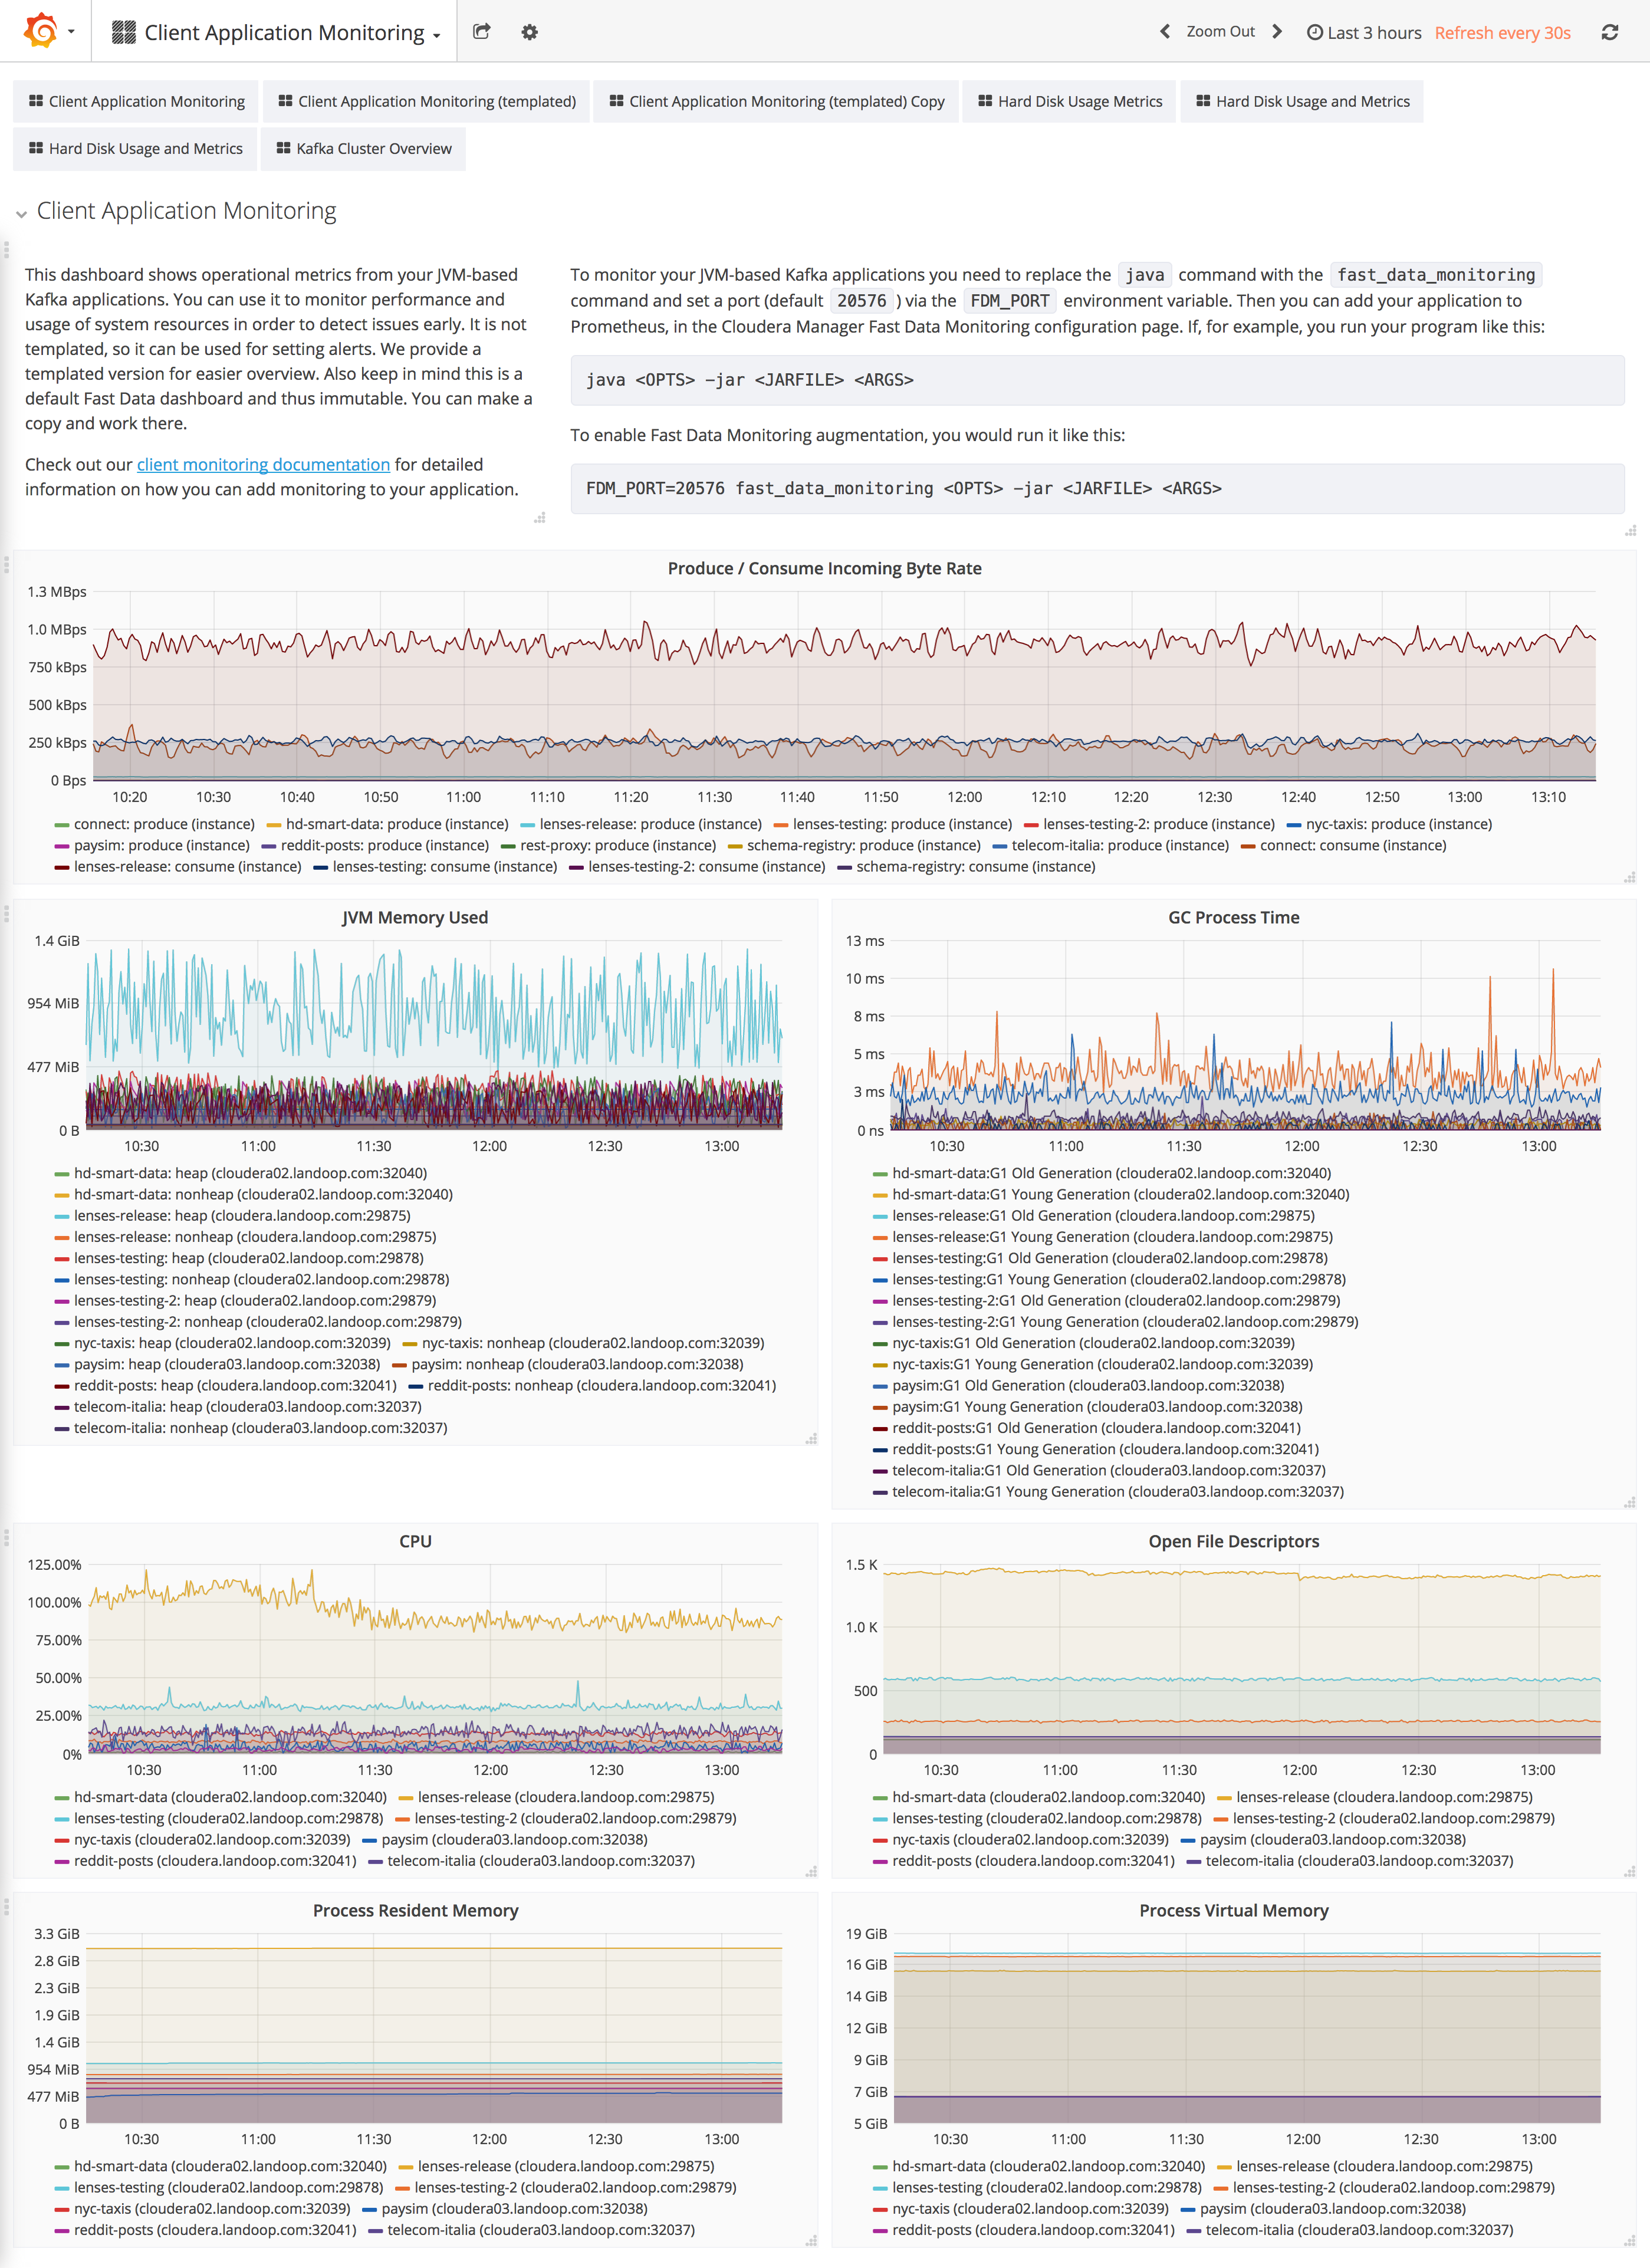
Client Application Monitoring
Operational metrics from your JVM-based Kafka applications. You can use it to monitor performance and usage of system resources in order to detect issues early. Full access to how JVM apps and the Garbage Collector behaves, as well as open file descriptors, and other critical aspects of your own applications.