Topologies
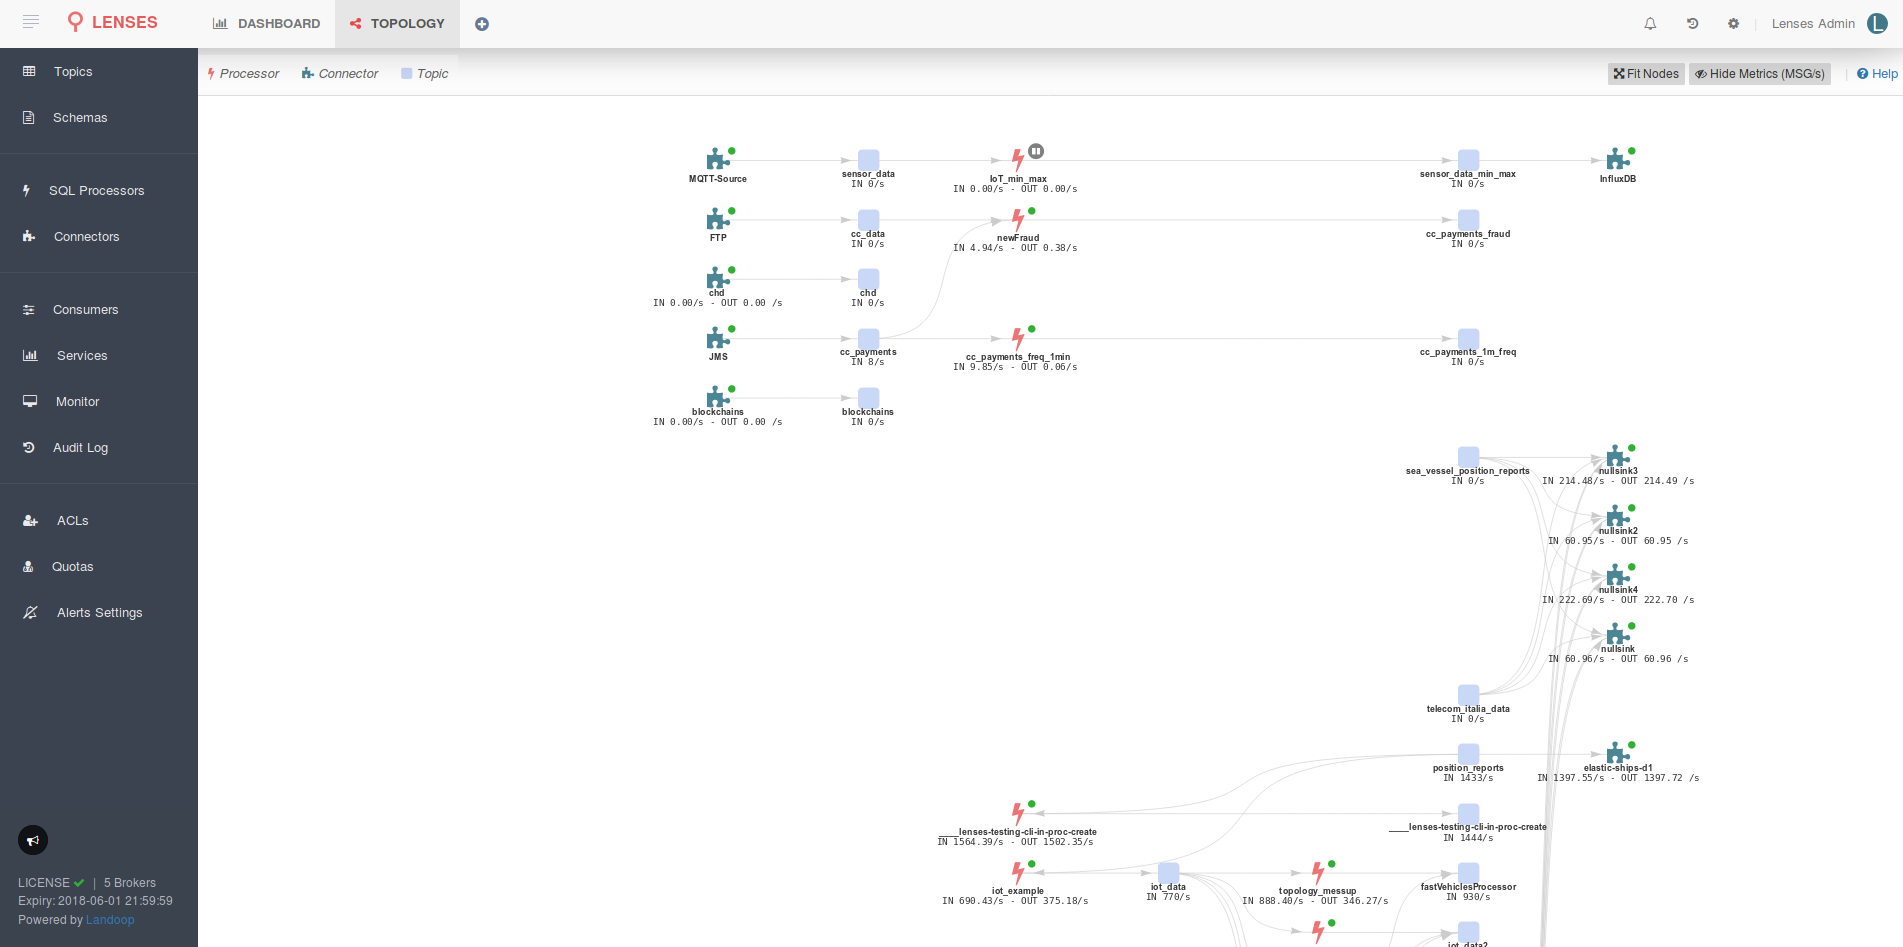
The platform is capable of understanding the data flow topologies and render them in one interactive graph. You can see in one graph all the data-flows:
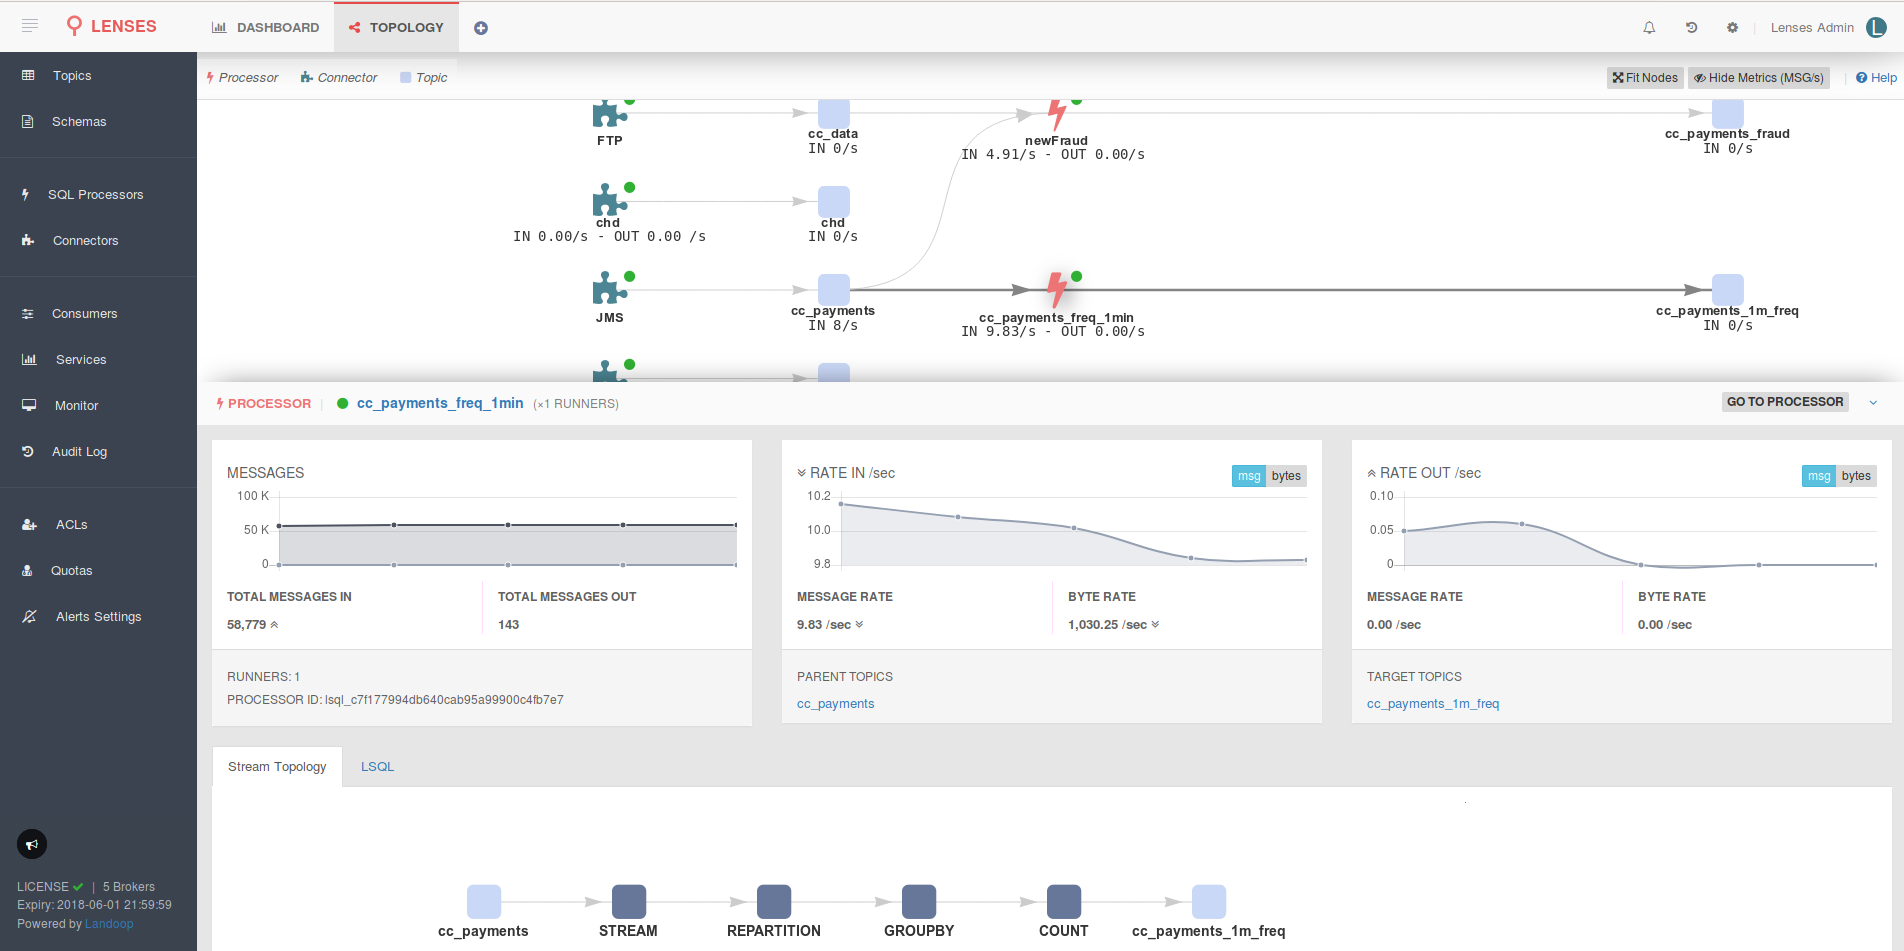
Each node in the graph can be interacted with to get a detail view. For example, on an LSQL node, it displays its own data flow graph alongside the metrics and the SQL code: