Operational Monitoring
Lenses for Apache Kafka Monitoring Suite is a set of pre-defined templates, that use
- A Time Series database (Prometheus)
- Custom JMX exporters
- A Data Visualization application (Grafana)
- Built-in domain intelligence about operating Kafka with confidence while in production
If you do not already have an existing installation of Grafana and Prometheus please visit their documentation for details and best practices.
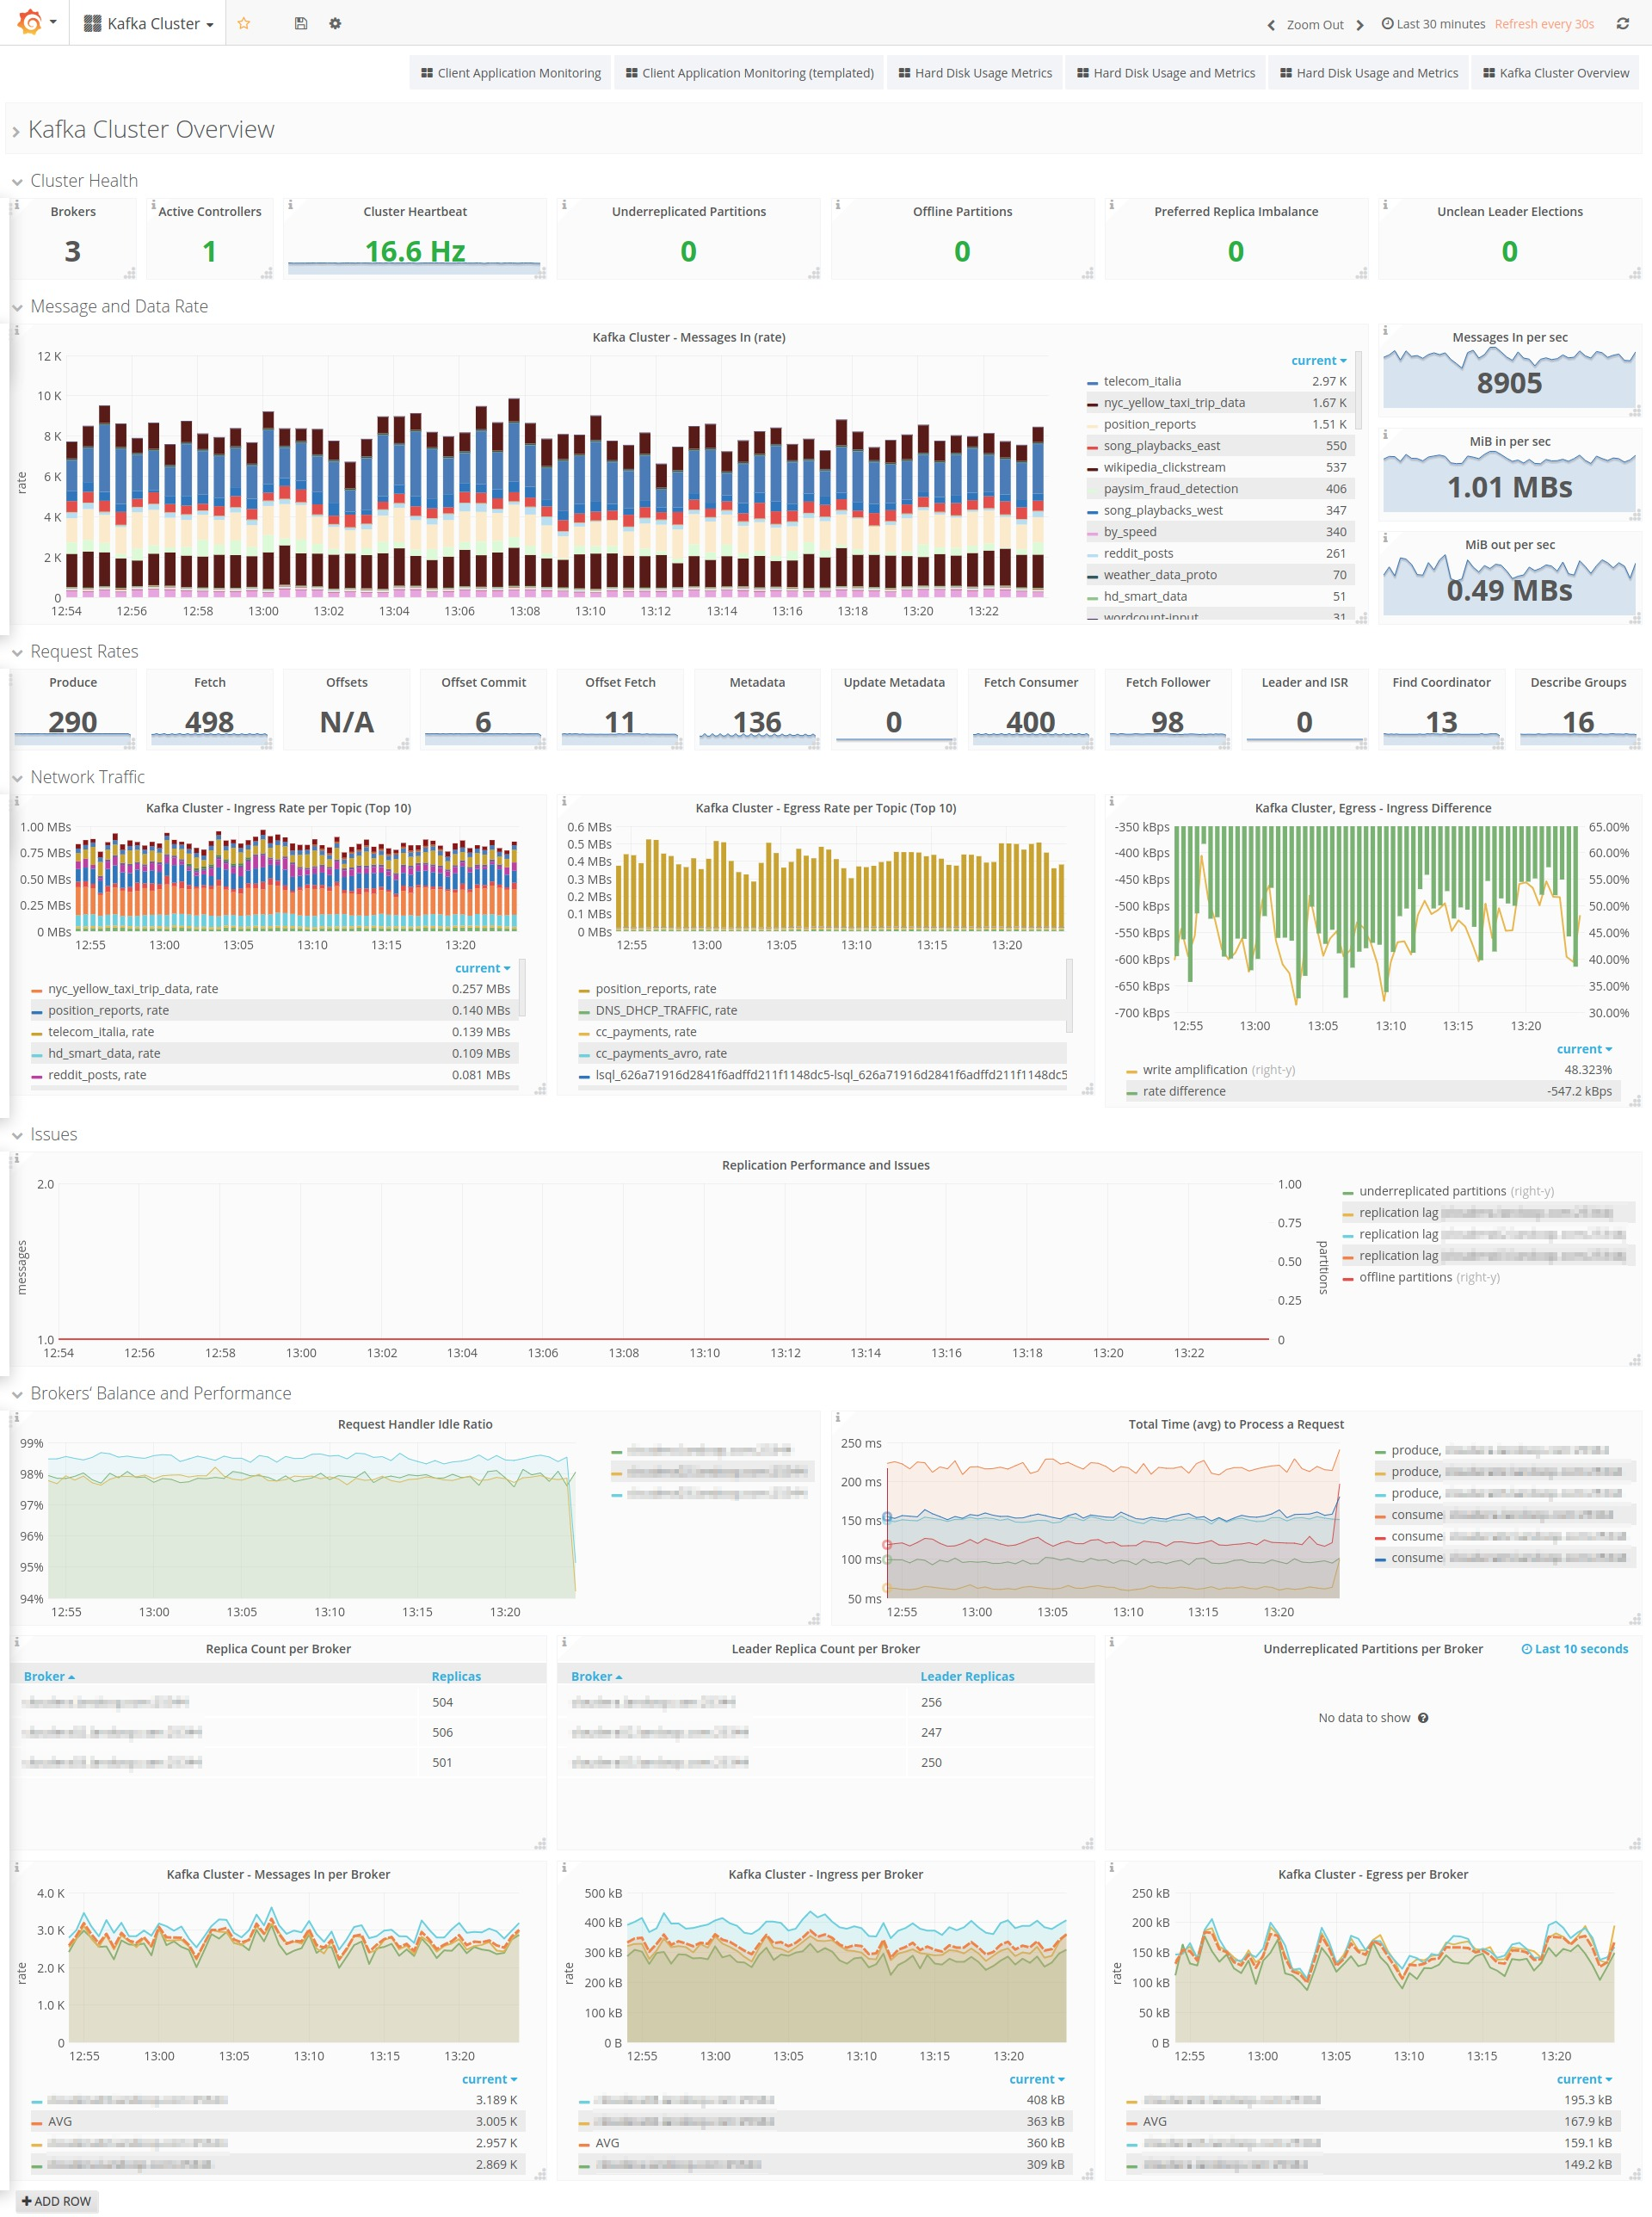
Lenses® for Apache Kafka Monitoring Suite | Kafka Cluster Overview Dashboard
Whilst Lenses continuously monitors your Kafka cluster and provides alerts and notifications for important metrics degradation, such as consumer lag and offline or under-replicated partitions, it does not strive to become a time-series database. Established solutions from domain experts already exist.
Landoop’s monitoring reference setup for Apache Kafka is based on Prometheus and Grafana software with a medium-term goal to bring more dashboards from Grafana into Lenses.
A question that comes, is whether monitoring is really needed since Lenses provides both alerts and notifications. What we come across, is that most teams already leverage an existing or open source solution, to monitor the components involved in the entire data journey. Thus we are offering the Monitoring Suite for Apache Kafka, as part of our Lenses platform which is meant to enhance your monitoring capabilities.
The philosophy we are following is: keep your alerts and key metrics to a small tight set so that you won’t get overwhelmed. This is the best practice, and thus among the thousands of metrics exported we are selecting and making available only the KPIs that are critical for monitoring your infrastructure.
Alerts and key metrics are related to monitoring but are not the same. We define monitoring as the process of collecting a large number of metrics and storing them for a period of time. Queries to these data help engineers understand the cluster behavior better, establish baselines so they can plan for additional capacity or act on deviations, or even extract new, important key metrics for a specific use case as the team acquires more experience. Furthermore, new alerts can be added to any metric or combination of them.
Setting up monitoring is currently an involved process. We strongly advise the operations teams that will implement the reference setup to integrate it with their own internal practices and guidelines.
Reference Setup
The reference setup uses 3 applications:
- Prometheus
- jmx_exporter in either server or agent mode
- Grafana
Prometheus is a time-series database that scrapes targets and stores metrics. Recorded metrics can be queried and a multitude of operators and functions is provided for queries. Prometheus’ model stores all recorded values in the database, in contrast with systems such as Graphite and RRD that store data in a custom —usually lower- resolution that degrades over time. This permits fine-grained results in queries at the expense of storage. Although Prometheus’ storage engine is very efficient, it is better to keep the metrics retention period shorter rather than longer. Typical values span from 15 days to a few months.
The Kafka ecosystem is based on the JVM and as such exports metrics via
JMX. Prometheus expects its own format for metrics and thus provides small
applications called exporters that can translate metrics from various
software. jmx_exporter is such an application, that converts JMX metrics to
the Prometheus format. It comes in two flavors: server (standalone) and agent.
In server mode, jmx_exporter runs as a separate application that connects to the
monitored application via JMX, reads the metrics and then serves them in
Prometheus format. In agent mode, it runs as a java agent within the application
to be monitored. For most services, the recommended mode is agent. It is
easier to setup and can provide operational metrics as well system metrics (CPU usage, memory
usage, open file descriptors, JVM statistics, etc). For the Kafka brokers, the
recommended mode is the server mode. The reason behind this is that under load
(hundreds or thousands of topics, clients, etc) the brokers can expose tens or
even hundreds of thousands of metrics! Under such high load, we have identified a
few cases where the jmx_exporter agent can’t keep up and may cause trouble to
the broker as well. The jmx_exporter running on a server mode will thus not
affect the broker. Jmx_exporter server instances should be co-hosted when
possible with the application they monitor, especially for software such as the
brokers that expose too many metrics.
Prometheus’ model scrapes data from exporters. This means that Prometheus should have a list of targets to scrape. This list may be set manually or automatically via supported backends —such as consul, Zookeeper, and Kubernetes.
Grafana is a tool for Data Visualization and Monitoring. It supports various data stores for querying data, amongst them Prometheus. It permits the user to create highly customized graphs, tables, gauges etc, leading to impressive and useful dashboards. Other notable features include templating for dashboards, alerts (via Slack, email, pagerduty, etc), LDAP support.
Configuration templates for the jmx_exporter and reference dashboards for grafana are provided as part of your Lenses subscription.
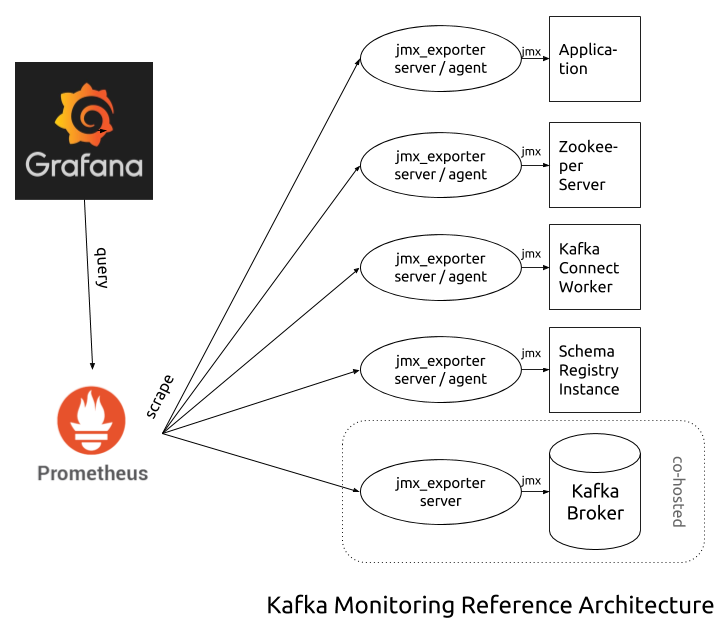
Lenses® Kafka Monitoring Reference Setup
Prometheus JMX exporter
jmx_exporter is a small, lightweight application that exports JMX metrics from a JVM based application and serves them via HTTP for Prometheus to scrape. It can either run as a java agent (inside the software to be monitored) or as a standalone server (separate process). Every program that needs to be monitored, needs its own instance of jmx_exporter.
A JVM-based application usually registers many MBeans for its various packages, each with its own number of metrics. Whilst jmx_exporter can perform a generic conversion of MBean metric names, it is important to have a configuration file, so the metrics can be processed: set predictable names, apply labels, define whether the metric acts as a counter or a gauge, drop ones that aren’t needed, apply unit conversions, etc. The final exported metrics should enable Prometheus to utilize its full potential and also lessen —if possible— the load of the monitoring infrastructure.
Landoop’s build of jmx_exporter (fastdata_agent.jar and
fastdata_server.jar) and configuration templates are available to all active subscriptions.
The choice between agent and server modes usually relies on the number of metrics the monitoring application will expose. For peripheral services (schema registry, Kafka connect) and client applications usually, the choice is straightforward; jmx_exporter in agent mode is easier to setup and besides Kafka metrics, it can also provide metrics for the JVM itself (CPU and memory usage, etc). For the brokers, the choice can be harder. Depending on the number of topics and consumers/producers, each broker may expose tens of thousands of metrics. In such a scenario it is better to have the jmx_exporter set as a standalone server, as in order to parse and process such a big number of metrics can create a significant load.
Running jmx_exporter as a java agent
Note
You can download the Lenses Monitoring Suite from your account. It includes fast data agent and server jars, as well as configuration files for Kafka brokers, Kafka Connect, Lenses —and other producers and consumers— and Schema Registry.
In the most simple form of a JVM application, a java agent can be utilized as:
java -javaagent:/path/to/fastdata_agent.jar=[PORT]:[CONF_FILE] -jar myapp.jar
Where [PORT] is the port where jmx_exporter will listen to for scrape requests
from Prometheus and [CONF_FILE] its configuration file.
Of course, there are deviations from this model, for example instead of a jar
with a main function, you may provide a classpath and a class, or for more
complicated software (such as the Kafka broker and Landoop’s Lenses) instead of
calling Java and providing jar files/classes, a shell script is used to properly
initialize the application. The important thing is to provide somehow the
-javaagent switch to Java.
In order to add the jmx_exporter java agent to your Kafka and Lenses (K&L) setup:
- Kafka Broker
Add the java agent configuration to the
KAFKA_OPTSenvironment variable:export KAFKA_OPTS="$KAFKA_OPTS -javaagent:/path/to/fastdata_agent.jar=[PORT]:/path/to/broker.yml"- Kafka Connect
Add the java agent configuration to the
KAFKA_OPTSenvironment variable:export KAFKA_OPTS="$KAFKA_OPTS -javaagent:/path/to/fastdata_agent.jar=[PORT]:/path/to/connect-worker.yml"- Lenses
Add the java agent configuration to the
LENSES_OPTSenvironment variable:export LENSES_OPTS="$LENSES_OPTS -javaagent:/path/to/fastdata_agent.jar=[PORT]:/path/to/client.yml"- Schema Registry
Add the java agent configuration to the
SCHEMA_REGISTRY_OPTSenvironment variable:export SCHEMA_REGISTRY_OPTS="$SCHEMA_REGISTRY_OPTS -javaagent:/path/to/fastdata_agent.jar=[PORT]:/path/to/schema-registry.yml"
Important
Prometheus must have access to jmx_exporter’s port but otherwise it is advised to keep jmx_exporter ports inaccessible from any other external hosts in order to have a more secure infrastructure setup.
Note
client.yml is a generic configuration file for all Kafka producer, consumer and streams applications.
As an example, at Landoop we use systemd to manage the Kafka brokers. Below is our systemd unit with monitoring set:
[Unit]
Description=Kafka Broker Service

[Service]
Restart=always
User=kafka
Group=kafka
Environment='KAFKA_HEAP_OPTS=-Xmx2G -Xms2G'
Environment=KAFKA_OPTS=-javaagent:/opt/lenses-monitoring/fastdata_agent=22000:/opt/lenses-monitoring/broker.yml
LimitNOFILE=100000
KillMode=process
TimeoutStopSec=600
ExecStart=/opt/kafka/bin/kafka-server-start /etc/kafka/kafka/broker.properties

[Install]
WantedBy=multi-user.target
Running jmx_exporter as a standalone server
In this mode, jmx_exporter runs as a separate process that connects to the instrumented application’s JMX port and retrieves metrics. Then it exposes them via HTTP for Prometheus to scrape.
It is strongly advised to run the jmx_exporter server on the same host that runs the application to be monitored for two reasons, (a) in order to read all metrics, multiple network requests are needed due to the way JMX works and even the tiny roundtrip time within a data center can add up to measurable delays, (b) access from the same host to JMX is much easier to setup (works by default).
The java server can be utilized as:
java -jar /path/to/fastdata_server.jar [PORT] [CONF_FILE]
Where [PORT] is the listening port for scrape requests from Prometheus and [CONF_FILE]
the configuration file. Apart from setting which metrics to process and how, the connection details are also set.
Important
Prometheus must have access to jmx_exporter’s port but otherwise it is advised to keep jmx_exporter ports inaccessible from any other external hosts in order to have a more secure infrastructure setup.
Within our monitoring archive you will find five configuration files for jmx_exporter:
broker.yml, client.yml, connect-worker.yml, kafka-rest.yml,
schema-registry.yml. The client.yml file can be used with any JVM based application
that uses the official Kafka Java libraries —such as Lenses or your own Kafka clients.
When using them in server mode, create a copy to use and with a text editor, edit (or add) the
configuration option hostPort to point at the JMX address of your application. Please note
that if jmx_exporter and your application are on the same host, you can use localhost:[JMX_PORT]
where [JMX_PORT] is the JMX port of your application. If the applications run on different servers,
you have to use the FQDN of your server and also configure your application to allow remote JMX
connections.
To enable JMX on your application the process may vary. For the Kafka ecosystem (Kafka Brokers, Zookeeper,
Schema Registry, Kafka Connect) it is enough to export the environment variable JMX_PORT=[JMX_PORT],
where [JMX_PORT] is the port the application should listen to for JMX connections. Lenses can expose
JMX at the default port 9015 unless you explicitly set the lenses.jmx.port setting.
In order to add the jmx_exporter java server to your Kafka and Lenses (K&L) setup:
- Kafka Broker
Enable JMX by exporting the port as an environment variable via
JMX_PORT:export JMX_PORT=[JMX_PORT]Optionally enable remote access to JMX by exporting the
KAFKA_JMX_OPTSenvironment variable:export KAFKA_JMX_OPTS=-Dcom.sun.management.jmxremote -Dcom.sun.management.jmxremote.authenticate=false -Dcom.sun.management.jmxremote.ssl=false -Dcom.sun.management.jmxremote.local.only=false -Dcom.sun.management.jmxremote.rmi.port=[JMX_PORT]Copy
broker.ymland add an entry about the location of the broker:hostPort: localhost:[JMX_PORT]
Finally start the server:
java -jar /path/to/fastdata_server.jar [PORT] /path/to/broker.yml- Kafka Connect
Enable JMX by exporting the port as an environment variable via
JMX_PORT:export JMX_PORT=[JMX_PORT]Optionally enable remote access to JMX by exporting the
KAFKA_JMX_OPTSenvironment variable:export KAFKA_JMX_OPTS=-Dcom.sun.management.jmxremote -Dcom.sun.management.jmxremote.authenticate=false -Dcom.sun.management.jmxremote.ssl=false -Dcom.sun.management.jmxremote.local.only=false -Dcom.sun.management.jmxremote.rmi.port=[JMX_PORT]Copy
connect-worker.ymland add an entry about the location of the worker:hostPort: localhost:[JMX_PORT]
Finally start the server:
java -jar /path/to/fastdata_server.jar [PORT] /path/to/connect-worker.yml- Lenses
By default, JMX endpoint is available at port
9015. Set a different port by settinglenses.jmx.portin the configuration file:lenses.jmx.port=[JMX_PORT]Optionally enable remote access to JMX by exporting the
LENSES_JMX_OPTSenvironment variable:export LENSES_JMX_OPTS=-Dcom.sun.management.jmxremote -Dcom.sun.management.jmxremote.authenticate=false -Dcom.sun.management.jmxremote.ssl=false -Dcom.sun.management.jmxremote.local.only=false -Dcom.sun.management.jmxremote.rmi.port=[PORT]Copy
client.ymland add an entry about the location of Lenses (or any other Kafka client):hostPort: localhost:[JMX_PORT]
Finally start the server:
java -jar /path/to/fastdata_server.jar [PORT] /path/to/client.yml- Schema Registry
Enable JMX by exporting the port as an environment variable via
JMX_PORT:export JMX_PORT=[PORT]Optionally enable remote access to JMX by exporting the
SCHEMA_REGISTRY_JMX_OPTSenvironment variable:export SCHEMA_REGISTRY_JMX_OPTS=-Dcom.sun.management.jmxremote -Dcom.sun.management.jmxremote.authenticate=false -Dcom.sun.management.jmxremote.ssl=false -Dcom.sun.management.jmxremote.local.only=false -Dcom.sun.management.jmxremote.rmi.port=[PORT]Copy
schema-registry.ymland add an entry about the location of the Schema Registry:hostPort: localhost:[JMX_PORT]
Finally start the server:
java -jar /path/to/fastdata_server.jar [PORT] /path/to/schema-registry.yml
In a Kubernetes setup, you would probably want to co-host a service with its jmx_exporter in the same pod.