4.2
Monitoring
Kafka monitoring for infrastructure and applications is available:
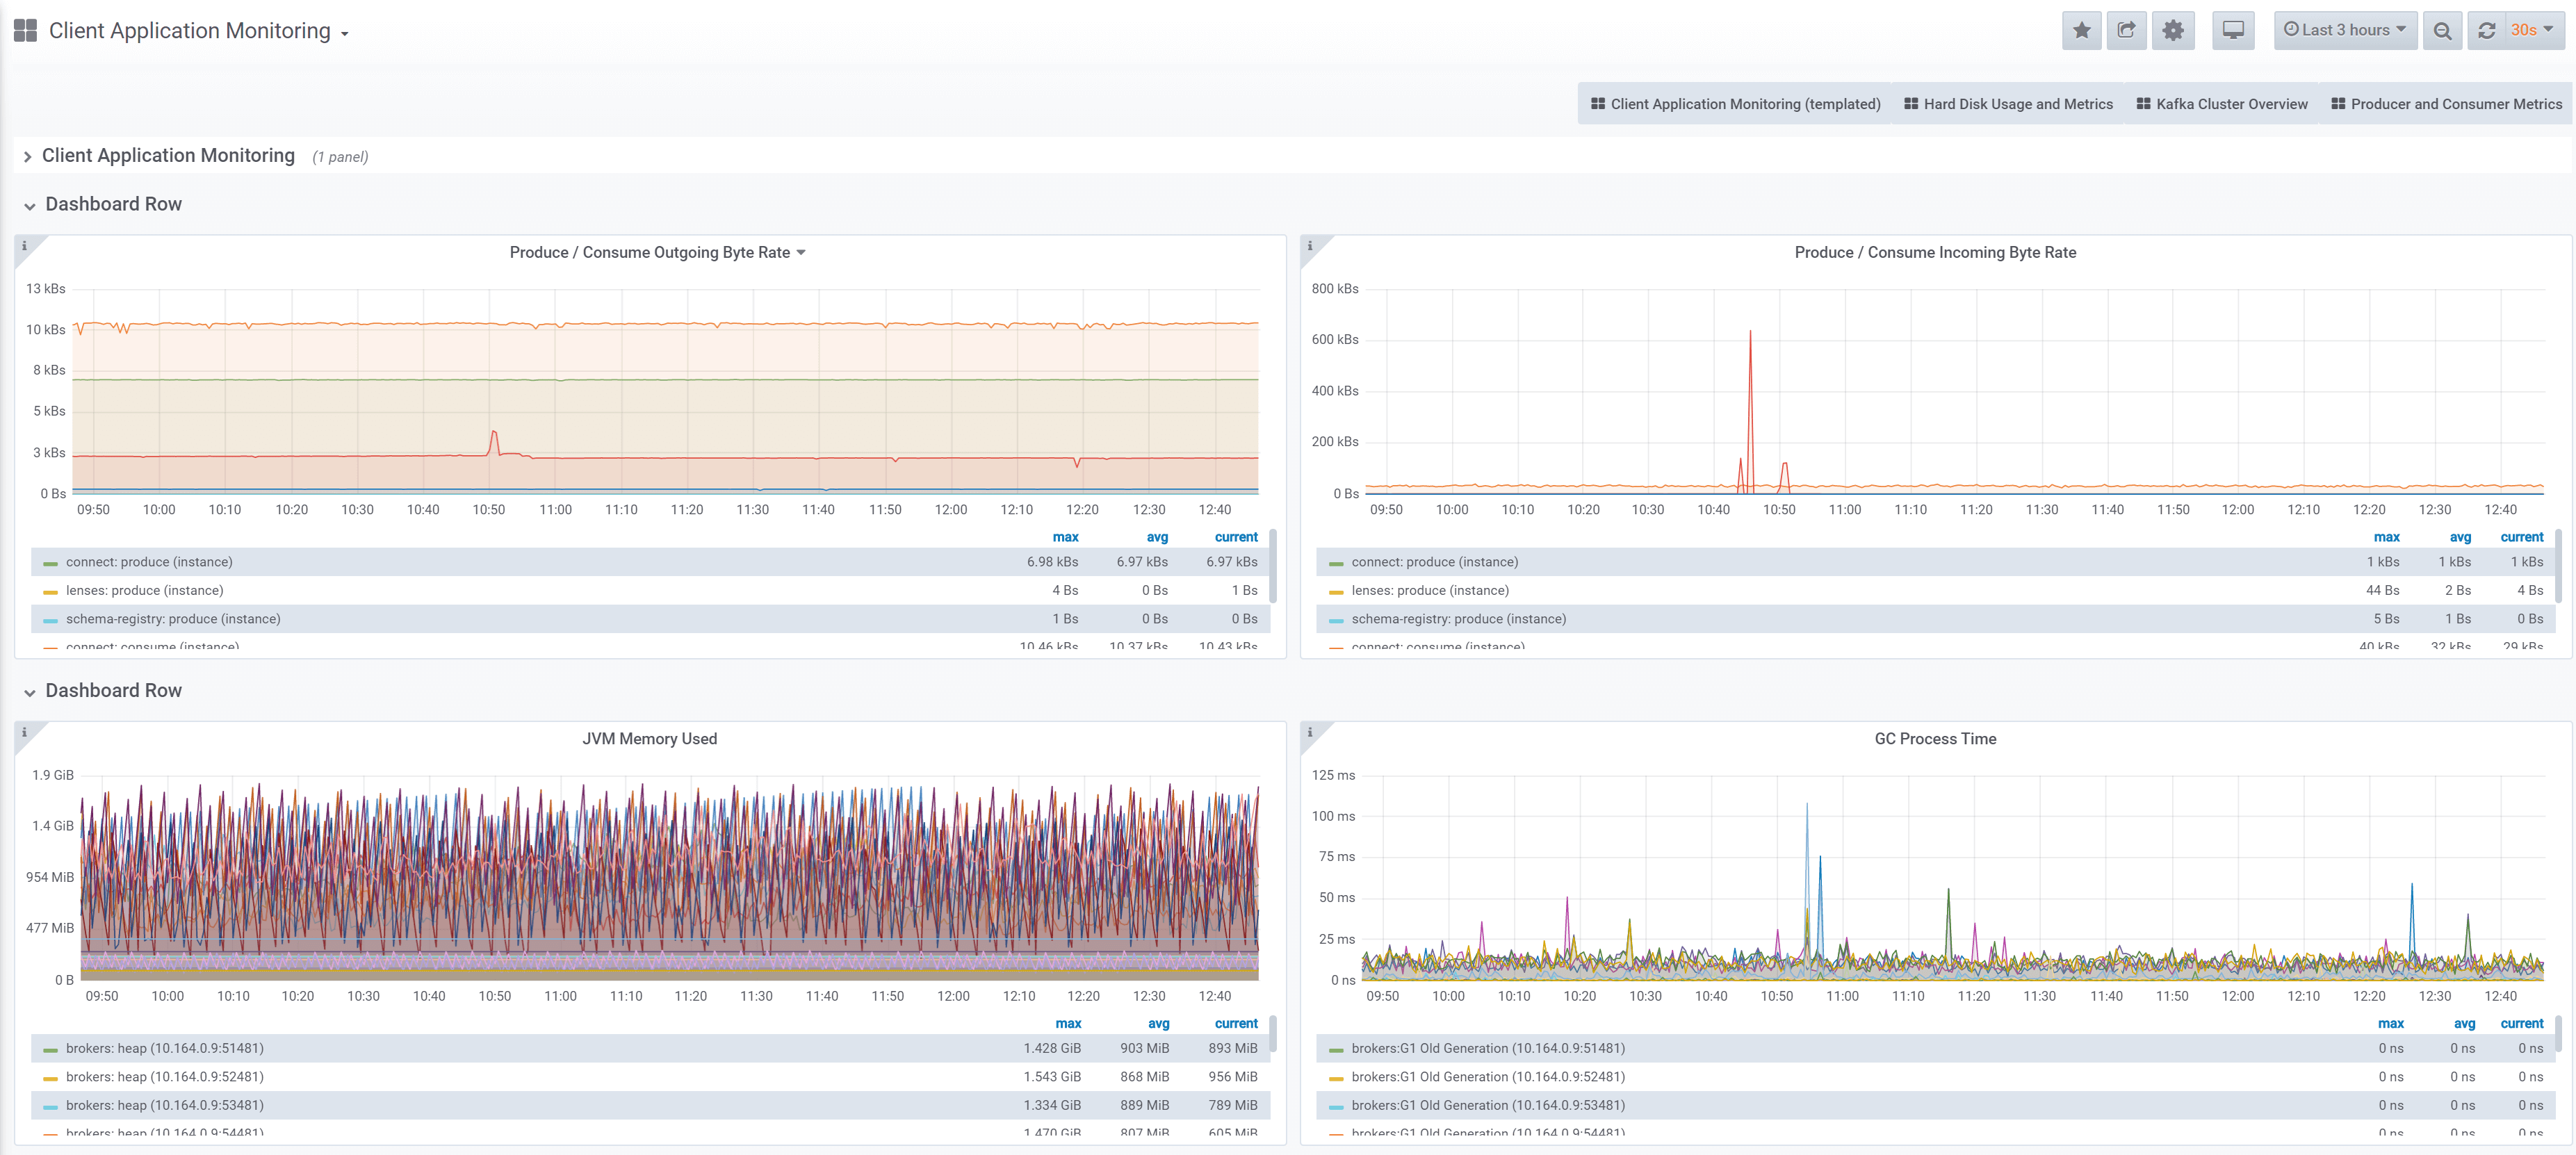
Kafka Monitoring with Prometheus and Grafana
For integration with Prometheus and Grafana Lenses provides templates and dashboards for historical monitoring of real-time applications and Kafka clusters.
Lenses for Apache Kafka Monitoring Suite is a set of pre-defined templates, that use:
- A Time Series database (Prometheus)
- Custom JMX exporters
- A Data Visualization application (Grafana)
- Built-in domain intelligence about operating Kafka with confidence while in production
If you do not already have an existing installation of Grafana and Prometheus please visit their documentation for details and best practices.
Get the Grafana Monitoring Suite
Steps:
1. Log in to secure.lenses.io
Log in with your client credentials.
This is the secure area account that you get with Lenses when you sign up. Contact your account representative if you don’t have them already.
2. Download and extract the suite
Download the suite package:
lenses-monitoring-suite-vX.Y.Z.tar.gz

Extract the package:
tar -xvf lenses-monitoring-suite-vX.Y.Z.tar.gz
The directory structure is:
   lenses_monitoring
   ├── grafana/      <- Grafana dashboards here
   ├── jmx_exporter/ <- fastdata_server.jar exporter here
   ├── LICENCE.txt
   ├── prometheus/   <- Prometheus configuration here
   └── README.md     <- Installation instructions here
3. Install the suite components
Find the detailed instructions in the README.md.
There are 3 components:
grafana/- Grafana dashboardsjmx_exporter/- JMX exporter jar for Prometheus. Use it with your Kafka brokers, Connect, Schema Registry or your JVM apps.prometheus/- Prometheus configuration
Prometheus metrics exporter
To use the Lenses Grafana dashboard configure the Prometheus JMX exporter with the configuration files located in your client area along with a packaged export jars. The following are available for each service:
- broker.yml
- client.yml
- connect-worker.yml
- kafka-rest.yml
- schema-registry.yml
Start the exporter in server mode:
java -jar /path/to/fastdata_server.jar [PORT] [CONF_FILE]
Where [PORT] is the listening port for scrape requests from Prometheus and [CONF_FILE] the configuration file.
To run as a Java agent, add the following to the environment variables controlling JMX for each service:
Kafka Broker
export KAFKA_OPTS="$KAFKA_OPTS -javaagent:/path/to/fastdata_agent.jar=[PORT]:/path/to/broker.yml"
Kafka Connect
export KAFKA_OPTS="$KAFKA_OPTS -javaagent:/path/to/fastdata_agent.jar=[PORT]:/path/to/connect-worker.yml"
Lenses
export LENSES_OPTS="$LENSES_OPTS -javaagent:/path/to/fastdata_agent.jar=[PORT]:/path/to/client.yml"
Schema Registry
export SCHEMA_REGISTRY_OPTS="$SCHEMA_REGISTRY_OPTS -javaagent:/path/to/fastdata_agent.jar=[PORT]:/path/to/schema-registry.yml"